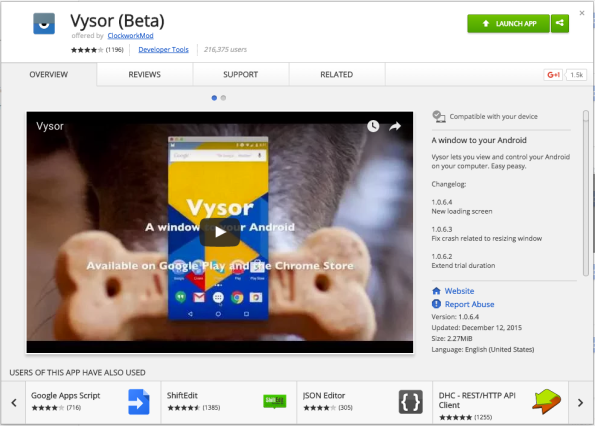
Mirror your Android Phone on Mac/PC
Vysor is a Chrome add-on that allows you to mirror your Android phone on your Mac or PC when doing presentation through your mobile phone.
So far this is the easiest way as it does not require installation of any application whatsoever, plus it allows you to mirror multiple devices as long as it is connected to your machine.
- Launch your Chrome browser and go to Chrome webstore
2. Search for Vysor and click “Add to Chrome” button
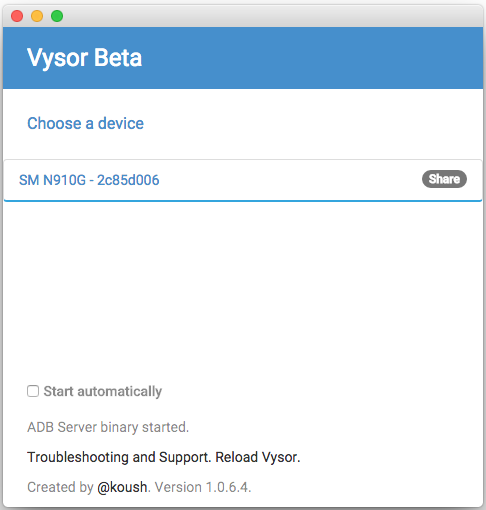
3. Connect your Android phone to your Mac/PC via USB
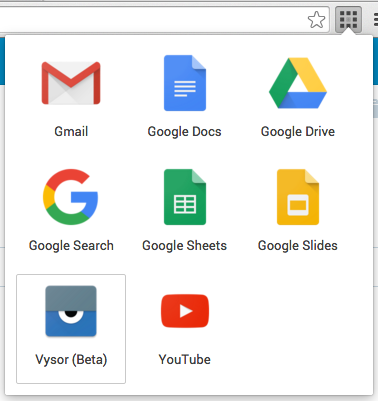
4. Launch the Vysor via the Chrome webstore or Chrome App Launcher
5. Choose the device that you want to share


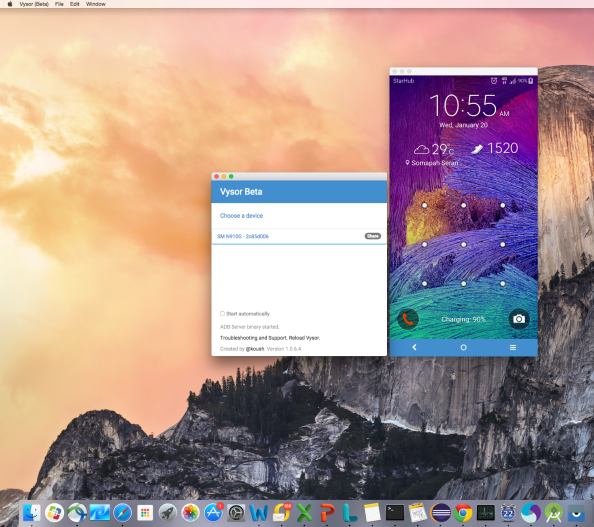
6. Now you can navigate through your mobile phone and project all the user actions in your desktop.
Cucumber: Passing Test Data as Table from Scenario
While we can pass test data as table from the feature file through Scenario Outline:
Scenario Outline: User updates user information
 Given I login to application
 And I go to user profile page
 And I enter "<gender>" into field of "gender_element";
 And I enter "<age>" into field of "age_element";
 And I enter "<location>" into field of "location_element";
 Then I verify user updates are saved
Examples:
 | gender | age | location |
 | Female | 20 | Singapore |
Here’s another option to pass your data in table format through your step definition.
Scenario: User updates user information
 Given I login to application
 And I go to user profile page
 When I update user information with options:
  | Gender | Female |
  | Age | 20 |
  | Location | Singapore |
 Then I verify user updates are saved
#Step Definitions File
#step definition to populate textfields
Then /^I enter "(.*)" into field of "(.*)"$/ do |value, field|
 textfield(I18n.translate!(field)).click
 textfield(I18n.translate!(field)).send_keys value
end

#step definition that accepts test data from the feature file as table
When /^I update user information(?: with options:)?$/ do |table|

 options = table.rows_hash
 step %Q[I enter "#{options['Gender']}" into field of "gender_element"]
 step %Q[I enter "#{options['Age']}" into field of "age_element"]
 step %Q[I enter "#{options['Location']}" into field of "location_element"]
 step %Q[I press button labelled "bt_address_suggestion_use_this"]

#step definition that accepts test data from the feature file as table with default value
When /^I update user information(?: with options:)?$/ do |table|
 default_value = {
 'Age' = "18",
 'Location' = "United States"
 }
 options = default_value.merge(table.rows_hash)
 step %Q[I enter "#{options['Gender']}" into field of "gender_element"]
 step %Q[I enter "#{options['Age']}" into field of "age_element"]
 step %Q[I enter "#{options['Location']}" into field of "location_element"]
 step %Q[I press button labelled "bt_address_suggestion_use_this"]
Cucumber: Using JSON Parser
JavaScript Object Notation(JSON) is a lightweight data-interchange format useful to generate and parse data
Sample Data:
{‘user’:{‘FirstName’:’User1′, ‘LastName’:’Sample’, ‘Gender’:’Female’, ‘BirthDate’:’01/01/1990′}}
Suppose we are to use the above user data, parse it into an hash and use the array hash as input to a sign up screen.
Here’s a snippet of how to use JSON in this particular scenario
require “json”

my_data = "{'user':{'FirstName':'User', 'LastName':'Sample', 'Gender':'Female', 'BirthDate':'01/01/1990'}}"

##method to parse user data

def getNewUserData

@new_user = JSON.parse my_data

{

:firstName => new_user['user']['FirstName'],

:lastName => new_user['user']['LastName'],

:gender => new_user['user']['Gender'],

:birthDate => new_user['user']['BirthDate']

}

end

##method to populate the sign up screen

def fillOutSignUpScreen

step %Q[I enter "#{@new_user[:firstName]}" to the "signup.firstname"]

step %Q[I enter "#{@new_user[:lastName]}" to the "signup.lastname"]

step %Q[I enter "#{@new_user[:gender]}" to the "signup.gender"]

step %Q[I enter "#{@new_user[:birthDate]}" to the "signup.birthdate"]

end
For more functions and complete library you may refer to http://www.ruby-doc.org/stdlib-2.0/libdoc/json/rdoc/JSON.html
Ruby: Using URI and HTTPClient
HTTPClient provides API library for user to access web resource using HTTP
This would be helpful if you need to access a different web URL other than your base URL that you used in your automation and validate the content of the page.
Here’s a snippet of how to use HTTPClient in this particular scenario
require “httpclient”

my_url = “http://CheckThisOut:8080”

##method to access my_url using URI

def accessPage

begin

uri_parsed = URI.parse(my_url)

client = HTTPClient.new()

client.ssl_config.verify_mode = OpenSSL::SSL::VERIFY_NONE

client.no_proxy = uri_parsed.host

uri = my_url

#invoke url to take the page content

puts “Accessing: #{uri}”

resp = client.get uri, :header => {’Accept’ =>‘application/json’}

rescue

puts(“Error encountered: #{$!.inspect}”)

end

end

puts "response: status = #{resp.status}"

puts "response: body = #{resp.body}"

fail "bad response #{resp.status} #{resp.reason}" unless resp.status == HTTP::Status::OK

page_content = resp.body

return page_content

end
For more functions and complete library you may refer to http://www.rubydoc.info/gems/httpclient/2.1.5.2/HTTPClient
Useful Git Commands
As our project migrated from SVN to GIT repository, I thought of writing a post of the usual git commands which I find helpful where I could easily refer to.
**Set up Local Repository
#clone a repository into a new directory locally
git clone <SSH key>
#checkout a branch or path to the working tree
git checkout <branch name>
**Working with Branches
#display all the available branches in your local, highlighting the active branch
git branch
#download all/new branches
git fetch
#switch working branch
git checkout <branch name>
#create new branch locally
git checkout -b <branch name>
#push newly created branch to remote
git push -u origin <branch name>
**Committing Local Changes to remote
#show staged files for commit, not staged files for commit and untracked files.
git status
#include what will be committed, stage the changes
git add <file>
#discard changes
git checkout — <file>
#to add message for commit
git commit -m “message here”
#take latest commits on the mentioned branch
git pull origin <branch name>
#push local changes to the remote
git push origin <branch name>
Cucumber: Verify page content from a data source
One good practice in “Cuking” is to not crowd your feature files with all the text validations. In this post I’ll be sharing how you can use an external data source to be compared with the actual UI page for content validation purposes.
First prepare your textfile by inputting all the expected content in the page you want to assert. Save this in a your desired location which later on you’ll need to specify in your step definition.
Step Definition
And /^I verify ([^"]*) page content$/ do |page|
 case page
   when 'Terms and Conditions'
     $file = File.expand_path(File.dirname(__FILE__) + '/{location of your file}/terms_and_conditions.txt')
   #you can add other pages to validate within the case
 end
 $content = File.open($file)
 $content.readlines.each do |line|
   puts "#{line}"
   page.text.should have_content("#{line}")
 end
end
In your feature file assuming all the other step definitions are in place, you’ll just need to call your ‘I verify ([^”]*) page content’ step with the page variable in our example ‘Terms and Conditions’
Scenario: User verify contents of Home page
  Given User go to Terms and Conditions page
  And I verify Terms and Conditions page content
In other cases that you nedd to save your text validations in a csv data source, for example maintaining a csv file with all the expected labels per page:

Your step definition should look something like this:
And /^I verify fields from "([^"]*)"$/ do |page|
  $source = "/{location of your file}/fields.csv"
  FasterCSV.foreach(File.expand_path(File.dirname(__FILE__) + "#{$source}"), :headers => true) do |row|
    begin
      if row.header?("#{page}")
        if row["#{page"] != nil
          puts row["#{page}"]
          $field = row["#{page}"]
          page.text.should match(/#{$field}/)
        end
      end
    rescue => e
      raise e
    end
  end
end
Then in your feature file, you just call the step definition with the csv’s column header as a parameter:
Scenario: User verify contents of Home page
  Given User go to Login page
   Then I verify fields from "Login Page"
   And User go to Registration Page
   Then I verify fields from "Registration Page"
Cucumber: Read from File
As your automated testing mature, you don’t want to limit users hard coding their application under test or browser driver all in the ENVironment file(env.rb). You can customized your environment by creating a configuration file where you can define variables like applications URL, timeout, database configurations and the like.
From the basic folder structure discussed in Automated Testing with Cucumber + Capybara post, add two more files:
environments.yml – contains all the environment variables that you can use
google:
 app_host: http://www.google.com

bing:
 app_host: http://www.bing.com
custom_config.rb – ruby code where you configure your code to read from a specific file
require "erb"

module CustomConfig
 unless defined? @@env_config
 puts "loading environments.yml..."
 env = (ENV['ENVIRONMENT'] && ENV['ENVIRONMENT'].to_sym) || :google
 environments = YAML.load(ERB.new(File.read(File.expand_path('../../../config/environments.yml', __FILE__))).result)
 @@env_config = environments[env.to_s]
 raise "No config found for environment: #{env}" unless @@env_config
 end

def env_config
 @@env_config
 end

end

World(CustomConfig)
Your base folder should look like these by now:

Revised Base Folder
Then edit your env.rb by adding the following lines to your environment file.
require File.expand_path(‘../custom_config’, __FILE__)
include CustomConfig
Also update Capybara.app_host definition to look up to @@env_config. Your env.rb file should be edited to something like this:
env.rb
require 'capybara'
require 'capybara/cucumber'
require File.expand_path('../custom_config', __FILE__)
include CustomConfig

Capybara.default_driver = :selenium
Capybara.app_host = env_config['app_host']
Capybara.default_wait_time = 20

World(Capybara)
Notice in line #07 of your env.rb you are basically pointing app host to whatever environment you set in your custom_config.rb – env variable, (see line #06) for this example :google
From here on you should still be able to run your simple_search.feature file without error, the only difference is your code reads now from a specific file – environments.yml, through custom_config.rb.
Automated Testing with Cucumber + Capybara
In this post we will introduce another gem called Capybara.
Capybara is an acceptance testing framework with a higher level API and support for multiple backends, supports Selenium and runs in different browsers.
Others may ask, “Why would I use capybara if selenium could also drive the browser the way I want it?” Well, one advantage I appreciate is Capybara’s higher-level API compared to selenium.
Let’s take for example a simple scenario of typing strings to an input textbox:
Selenium-webdriver snippet
require 'selenium-webdriver'

element = driver.find_element :name => "q"
element.send_keys "Cucumber tests"
Capybara snippet
require 'capybara'

fill_in "q", "Cucumber tests"
You can obviously see from this example that Capybara enforces easier writing scripts ability. For a complete documentation on Capybara you can check this link from Github which I found very helpful.
After installation setup discussed in my previous post Introduction to Cucumber, you need to have the following folder structure and files:
I. Base Folder

Base Folder Structure
where:
features – folder to host all your feature files
step_definitions – folder to host all your step definition Ruby files
support – folder to host your configuration files (env.rb)
Gemfile – defines the top-level gems to be used in your project
II. Features
– describes the features that a user will be able to use in the program
Sample: simple_search.feature
Feature: As a user I should be able to perform simple google search

Scenario: A simple google search scenario
 Given I am on the main google search
 When I fill in "q" with "Cucumber test"
 And I click "gbqfb" button
 And I click on the first result
 Then I should see "Cucumber lets software development teams describe how software should behave in plain text."
III. Step Definition
– describes the actions that user will do for each step.
Sample: search_step.rb
Given /^I am on the main google search$/ do
 visit ('/')
end

When /^(?:|I )fill in "([^"]*)" with "([^"]*)"$/ do |field, value|
 fill_in(field, :with => value)
end

Then /^I click "([^"]*)" button$/ do |button|
 click_button(button)
end

Then /^I click on the first result$/ do
 find(:xpath, "//html/body/div[3]/div[2]/div/div[5]/div[2]/div[2]/div/div[2]/div/ol/li/div/h3/a").click
end

Then /^I should see "([^"]*)"$/ do |text|
 page.should have_content(text)
end
IV. Support
– hosts all configuration files
Sample: env.rb
require 'capybara'
require 'capybara/cucumber'

Capybara.default_driver = :selenium
Capybara.app_host = "http://www.google.com"
Capybara.default_wait_time = 20

World(Capybara)
V. Gemfile
– a format for describing gem dependencies required to execute Ruby codes
Sample: Gemfile
source "http://rubygems.org"

group(:test) do
 gem 'cucumber'
 gem 'capybara'
 gem 'rspec'
end
VI. Run
Using terminal go to your root project folder and type: cucumber or bundle exec cucumber
After the run, you should be able to see the results like this:
1 scenario (1 passed)
5 steps (5 passed)
0m9.461s
This example runs smoothly in Windows 7. Let me know if it works for you as well.
Introduction to Cucumber
More than a testing tool, Cucumber is a collaboration tool.
It is designed to accommodate both the technical(developers, automation testers) and non-technical(stakeholders, product owners) members of the software development team.
Cucumber supports behavior-driven development(BDD). In BDD, users(business analysts, product owners) first write scenarios or acceptance tests that describes the behavior of the system from the customer’s perspective, for review and sign-off by the product owners before developers write their codes.
When you run your test, Cucumber reads through user-readable files called features, parse it to scenarios which contains set of steps that are then matched to a step definitions of Ruby code using a regular expression.
Feature files could be deceiving. It may look simple and plain in the outside. But complex in the inside, within step definition or the ruby files which controls the flow of actions and where all the magic happens.
In order for Cucumber to understand the feature files, it uses a basic syntax called Gherkin. Gherkin makes use of the following keywords for documentation and readability — Feature, Background, Scenario, Given, When, Then, And, But, *, Scenario Outline and Examples.
To dive more information about Cucumber, I would recommend you read The Cucumber Book which have valuable information you would need in learning this new technology.
In preparation to your Cucumber testing experience, will be needing to setup the following in your local machine.
1. Java installation – JRE will do, mine is Java(TM) SE Runtime Environment 1.6
2. Ruby installation – visit their Downloads page. I have Jruby 1.6.7.2 installed in my box.
Don’t forget to define Java and Ruby Path in your system’s environment variables as well.
3. RubyGems installation – use “gem install <name of gem>” command. Here are some of the basic, helpful gems:
– Cucumber
– Capybara
– Rspec
If you’re all setup, feel free to jump to the next post – Automated Testing with Cucumber + Capybara
Reference: The Cucumber Book by Matt Wynne and Aslak Hellesoy


Recent Comments